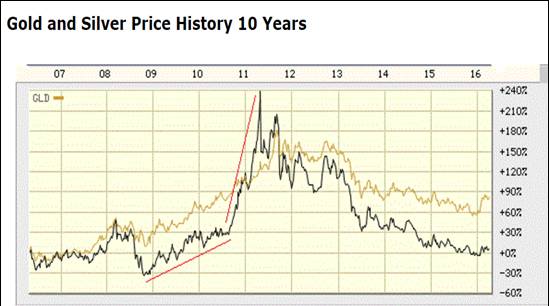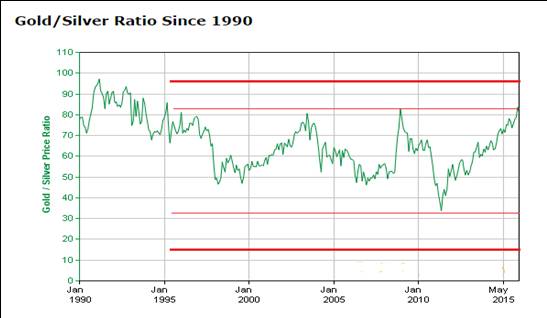

How do you read the above two graphs sourced from Seeking Alpha ?
An Investment Case for Silver Perhaps !?
From one graph that shows the Price trends over last 10 years you can observe that the Prices of both the bullion,Gold & Silver are directly co-related,albeit with some varying intensity
The second graph shows the Gold to Silver Ratio over the last 25 years and drives home a point that the varying intensity of price movements between the two offers opportunities
Currently as on April 11,2016 ,per oz Gold rules at @ US $ 1250 levels and Silver at @ US $ 15 => 83% G/S ratio….you observe that this 21st Century in the past 15 years the 80% mark has been just about reached just thrice,including now in 2016 with gaps of several years…over most periods it has remained in the 50% to 60% range and only once a few years ago dropped to @ 30% …over 90% was way back in the 1990-95 period
So what are the scenarios for Silver in the next three years?
- Very Bullish ~ Silver rises faster than Gold does to bridge this 83% ratio
- Moderately Bullish ~ Silver rises as Gold remains stable to bridge this 83% ratio
- Mildly Bullish ~ Silver rises but Gold rises faster and the G/S ratio moves over 90%+ like in 1990-95
- Mildly Bullish ~ Silver rises but Gold falls to bridge the 83% ratio
- Bearish ~ Gold falls and thus does silver
- Status Quo ~ Both Silver & Gold remain at current levels and maintain 80%+ ratio
Higher than normal 83% ratio strengthens probability of Bullish scenarios 1 & 2 for Silver
First Quarter of 2016 has seen Stocks & Sensex move lower….but as they say there’s a Silver Lining !
Now when will these Jewelers call of their Strike ! ?…or is there a Silver ETF you can play?
What’s your call on Silver?