So we all now concede that India is not decoupled from winds blowing in the US Stock markets…The Draft reaches our Exchanges too !
So it’s going to be Dow (n) with the Dow for our Sensex and Nifty too !
Three Interesting US Indicators support a further fall in our Sensex and Nifty to possible levels of under 7000 and 2000 respectively in 2009
JANUARY BAROMETER
Yale Hirsch devised this in 1972…Simply put it states that if the S & P 500 goes in January so goes the rest of the Year
From 1950 till 2008,this has held good in all,except 5 years,giving a remarkable 91.5% success rate
In January 2009,the S & P 500 fell 12 %….except for relief rallies ,expect the rest of 2009 too be on a down trend
What traditionally happens in normal and positive times in January is that Institution Outlays come into the Market and so Other Investors tend to pre-empt and warehouse Stock in December
However in bearish times like now,Investors await January Institutional Demand to exit….Thus if S & P goes lower in January,it clearly points to selling pressure despite Some Institutional Buying
DECEMBER LOW INDICATOR
Designed by Lucien Hooper,it simply predicts a further decline in the Market if the Dow closes lower than the December Low in the first quarter of the Calender Year
We have just begun February and this Low has already been breached…Since 1952 this has been proven 92.8% of the time
HISTORICAL PE
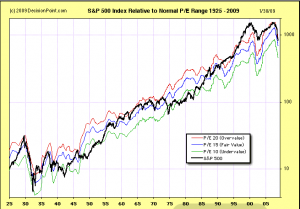
It has been generally accepted by Investors who hold a long term view that the P E of S & P 500 will indicate undervaluation at a level of 10,overvaluation at a level of 20 and Fair Value at a level of 15
But the contention is that this view is during a period of Higher Earnings Growth,Cheaper Finance and Leveraging
During a current long term scenario of an Earnings Slowdown and de-leveraging,Fair Value will be seen at PE levels lower than 15….probably 10…This is a justified PE derating
US Markets need to decline by 17% level and 44% level to reach Fair Value Perception at 15 PE and 10 PE respectively
Have a look below at the historical PE of the S & P 500 (The Black Line) from 1925 till date against Relative PEs (Red Line PE 20,Blue Line PE 15,Green Line PE 10 )
Clearly 1990s and 2007 was overvalued….late 1940s to early 1950s showed PE levels below 10…From mid 1980s till date the PE Levels have remained over 15 in expectation of Higher Earnings Growth….Now with deleveraging and Lower Earnings expect the PE to be derated back towards 10 and even below to match the changing perception of Fair Value at a lower PE Level of 10
If Panic sets in,then macro valuations are ignored and Sensex and Nifty will nose dive breaching even perceived as Fair PE Levels of 10
However there is some hope……India and China will continue to register higher relative growth rates,albeit lower than in previous years and may not be impacted going forward as much as US Stock Markets in the longer term…In 2008 ofcourse both these Asian markets have been decimated
BottomLine is to exercise Caution and not be in any hurry to average Equities or initiate fresh buying…Top Down Approach gives strong warning signals…a Bottom up Approach may be more rewarding…ofcourse the challenging times have thrown up disinclination to buy equities and an anti equity sentiment…so it gives you adequate time to contemplate equity strategies to restructure,rebalance and reposition equity Portfolios…you are not going to miss any boat if you don’t buy today !


